Transitioning on D3 annotations
19 Sep 2019After reading Sarah Reed’s article on why D3 is so hard to learn from bl.ocks I thought I better do a blog post explaining a recent bl.ocks I made to solve a problem I encountered in my recent project about the commuting gap.
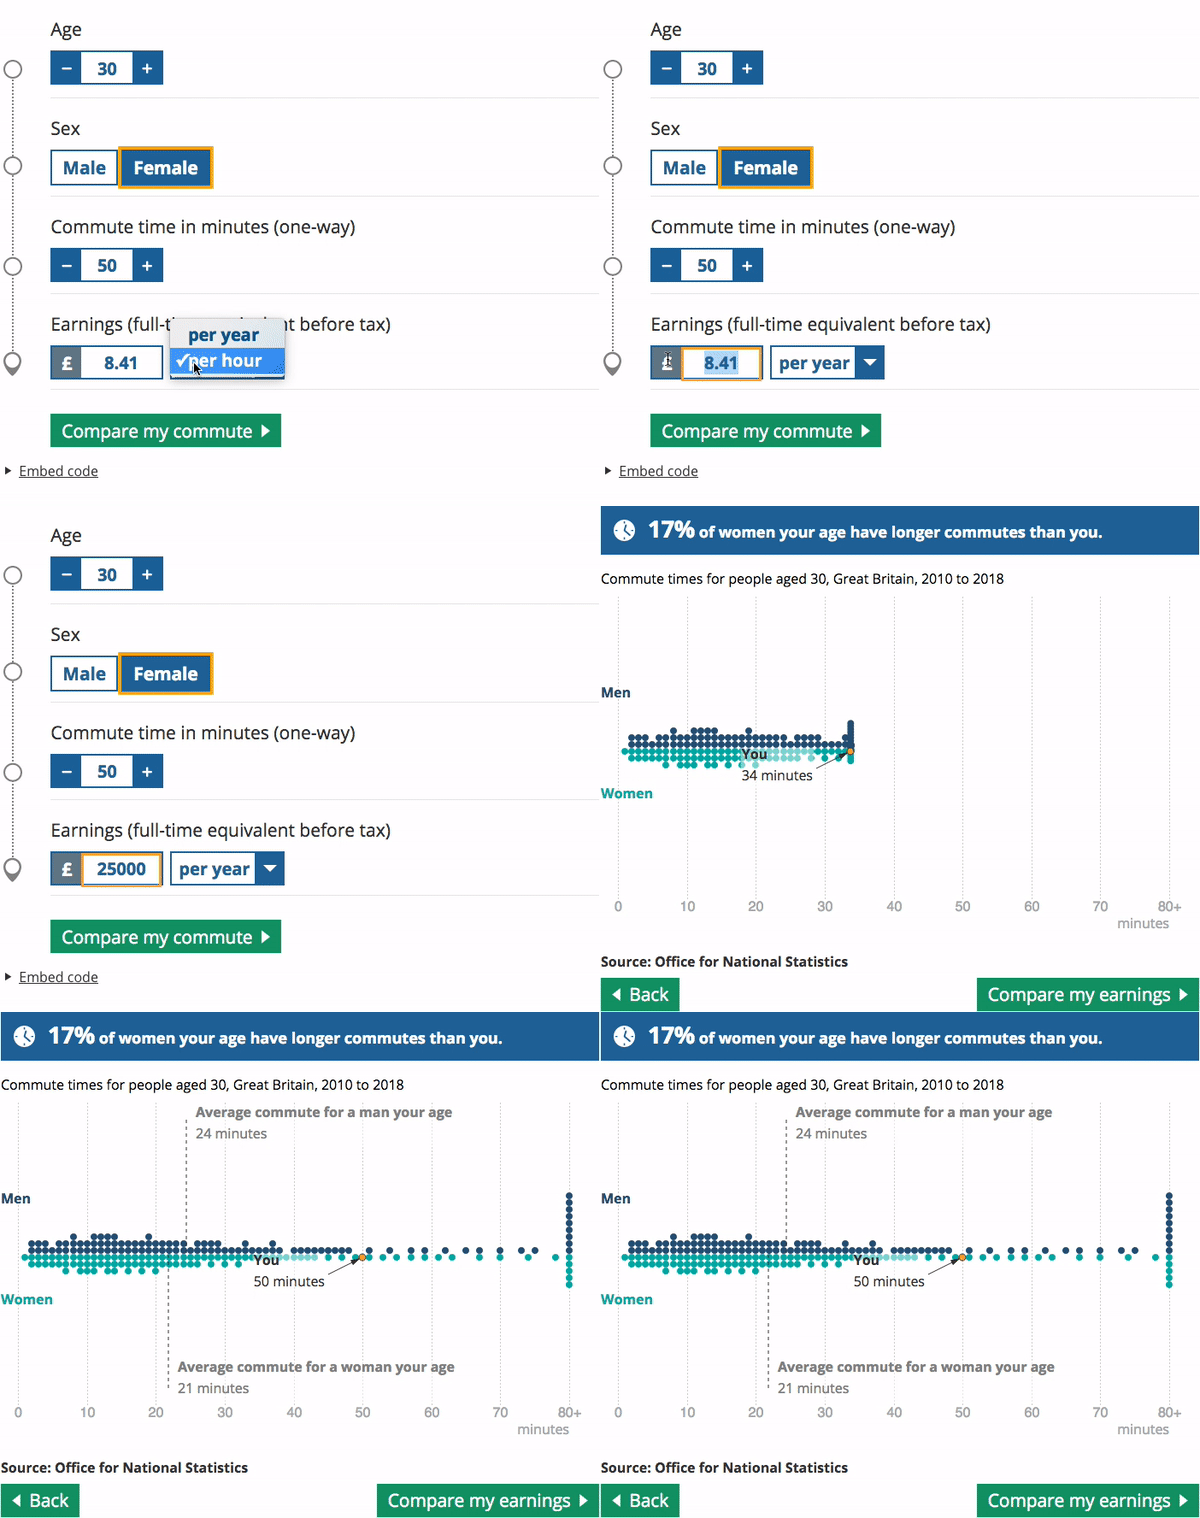
I wanted to create a dot histogram of the distribution of travel times and add a marker with an annotation for you. This is what it looked like in the page.

For the annotation, I use the d3-annotations library. I’ve written a tutorial for d3-annotations so I’d recommend starting there if you’re unfamiliar with it.
Here’s the example of transitions using d3-annotations I posted as a bl.ock.
Let’s break down the code bit by bit. First we create an svg on the page.
 var svg = d3.select("body").append("svg")
      .attr("width", 960)
      .attr("height", 500)
Next we set up a linear scale for the x position
 var x = d3.scaleLinear()
    .rangeRound([0, 960]);

    x.domain([0, 400])
We create the annotations array for d3-annotations
annotations = [{
        note: {
          label: "00:00",
          title: "You"
        },
        x:x(0),
        y:500/2,
        dy: 20,
        dx: 20,
        subject: {
          radius: 10,
          radiusPadding: 5
        },
        type:d3.annotationCalloutCircle
      }]
And then call d3.annotations to create the annotations in the svg.
      makeAnnotations = d3.annotation()
        .annotations(annotations)

      svg.append('g')
        .attr('class', 'annotation-group')
        .call(makeAnnotations)
Next we use a d3 transition but with a custom tween function.
d3.select('.annotation-group')
      .transition()
      .duration(4000)
      .tween('updateAnno',function(d){
        xTrans = d3.interpolateNumber(0,200)
        timeTrans = d3.interpolateDate(new Date("January 01, 2019 00:00:00"),new Date(new Date("January 01, 2019 00:00:00").getTime()+200*60000))
        return function(t){
          annotations[0].x = x(xTrans(t));
          annotations[0].note.label = d3.timeFormat("%H:%M")(timeTrans(t))
          makeAnnotations.annotations(annotations)
          makeAnnotations.update()
        }
      })
We need to set up some interpolators. There are some that exist in d3 for commonly used formats (numbers, dates). See the d3 documentation for interpolators for more info. We are going to use the number interpolator for the x position, going from 0 to 200. Let’s call this xTrans.
We use the date interpolator for time, calling this timeTrans, and we’re going from 00:00 to 03:20. For this we have to start at some arbitrary date at midnight then add 200 minutes to that time.
new Date("January 01, 2019 00:00:00").getTime() gets the time in milliseconds since the Unix Epoch, then to calculate how many more milliseconds we need to get we multiply 200 minutes * 60 seconds * 1000 milliseconds. Finally we make this a javascript Date object with new Date().
For the annotation, we set the position using the x property in the annotations object. We can now set to change with the ticker t. Every time the transition updates, it updates t and updates the anything that relies on t. We also use the scale to transform it from the data range to the svg range, and we get annotations[0].x = x(xTrans(t));.
We can change the label of the annotations. We use d3.timeFormat to change from the javascript Date format into something more human readable, here we’re using hours and minutes, d3.timeFormat("%H:%M"). Again we use our interpolator and the ticker t. Putting this together we get annotations[0].note.label = d3.timeFormat("%H:%M")(timeTrans(t)).
We now need to update the annotations with the updated values with makeAnnotations.annotations(annotations) and update the annotations on the svg with makeAnnotations.update().
And that’s it. You can make it data-driven which is what I did in the interactive by using variables for the end points of the interpolators and duration of the transition.