Accessible-as-possible colour palettes
12 Dec 2018Colours is a big part of what makes up graphics and making colours accessible is important.
The basics
Colour space
We’re used to thinking of colours in terms of red, green and blue. Add these colours together and you get white. We can describe colours using RGB, breaking up each colour channel into 256 parts. Increase the red channel and you get red. Add the blue channel and you get purple. Add the green channel and you’ll get white.
The human eye
This works quite well for computers, just add three numbers together to make a colour. The problem comes when we apply human physiology to the issue. Inside the eye, there are two type of cells that sense light: rods and cones. Rods mostly deal with low light and cones are used to tell colour in well-lit conditions.

The three rods are sensitive to different wavelengths of light, with one roughly at blue, yellow and red. But these don’t respond linearly (i.e. a light twice as bright doesn’t send a signal twice as strong). That graph has been normalised so every peak is at 1. It doesn’t show that our eyes are most sensitive to green light than red, and more sensitive to red than blue. What this means is that we should consider what colours our eyes are drawn to, what colours make up the data vis and what parts of the visual you’d like to draw attention to. Perhaps you need to use a colour to highlight a specific aspect.
A different way to think about colour
An alternative way of thinking about colour instead of RGB is Hue, Chroma, and Lightness (HCL). The advantages of using HCL is that it takes into account the way the human eye perceives colour.
Hue is the shade (red,green,blue), Chroma is the richness of colour (it’s a bit like saturation but takes into account the colour of other white objects). Lightness is the perceived brightness of that colour.
Whereas RGB could be imagined as a cubic colour space with each dimension going from 0 to 255. HCL works in a cylindrical colour space. Hue ranges from 0-360°. Chroma start at 0 but the maximum can vary with hue and lightness. Lightness is from 0 to 100. Lightness is also dependent on hue and chroma.
Colour considerations
Contrast ratio
The most relevant part of web guidelines regarding colour relate to text. They say for WCAG AA compliance text and images of text should have a minimum contrast ratio of 4.5:1 for normal text and 3:1 for large text. Contrast ratio is calculated by comparing the relative luminance of the lighter colour divided by the relative luminance of the darker colour. What’s important to note is that it doesn’t depend on hue as people’s colour vision are different and it’s the contrast in lightness.
The first thing to note is that this related to text and having enough colour difference to determine letterforms. Charts and interactives can contain many things other than text such as bars, lines, squares, circles and other shapes. All of these shapes can be big or small or a mix. Smaller objects would need a higher contrast ratio whereas a high contrast colour for large blocks would be too strong.
Also with most interactives and especially maps, you have colours next to each other rather than on a background. So there needs to be some consideration of the difference between colours and that you have enough that they are distinguishable.
Represents your data
Be mindful that when using colour to represents your data that it shows the relationships in your data. e.g. if your data is different categories, your colours should be as distinct as possible. If your data is sequential or represents a range, colour should change in a sensible way.
Semantics
Colour also has semantic meaning. We’re tired of seeing blue for males and pink for females for any dataset, but it’s hard to break away from the associated meaning of those colours. Datawrapper did a recent review of what colours people are using to represent gender.
Be careful to check what those colours could mean for people. Meanings also vary culturally and with language (e.g see this wikipedia article on blue-green) so may mean different things outside what you’re used to.
Colour blindness
I am colourblind myself (slightly red/green) which is useful when it comes to calling out bad colours on charts. Approximately 8% of men are colourblind and 0.5% of women. There are two main types, difficulty seeing red/green and difficulty seeing blue/yellow.
The best write up I’ve seen about testing colours in charts for colourblindness comes from Gregor Aisch of datawrapper. He applies simulated colour blind vision to a set of colour and then looked at difference between colours. Where the differences are not great enough a warning is given.
You can check your colour palette in datawrapper and check if they give any warnings.
How to pick colours
So now we’ve learnt about colour and we’re aware of all the considerations we have to take we can start choosing colours.
Let’s start with the easy one first.
Sequential colours
To make a good sequential colour scale, you need to vary chroma and lightness of the colours through the scale.
Let’s start with a colour that low in chroma and high in lightness. This is going to be a pale blue.
We want another colour that’s the opposite so high chroma and low in lightness.
And let’s make a scale that add three steps in between.
| Colour | Chroma | Lightness | Hue |
|---|---|---|---|
| #eff3ff | 6.275 | 95.86 | 277.995 |
| #bdd7e7 | 11.999 | 84.58 | 243.693 |
| #6baed6 | 28.73 | 68.205 | 248.879 |
| #3182bd | 38.134 | 52.164 | 263.369 |
| #08519c | 47.432 | 34.672 | 281.958 |
Analysing the colours we can see chroma increases and lightness decreases. If you think this palette looks familiar you’d be right. It’s the blue palette from colorbrewer.
This is a single hue palette as although the hue varies, it’s pretty constant.
Multi-hue sequential palettes
Although this colour scale is good, there are benefits from using multi-hue sequences. From Gregor Aisch’s article on colour
Hue variation provides a better color contrast and thus makes the colors easier to differentiate.
But as the creators of colorbrewer say, they are tricky to create because
“all three dimensions of colour are changing simultaneously”.
(The reason why multi-hue palettes are better are explained in more depth in this article. )
Luckily for us Gregor Aisch has created a tool to help create smooth palettes by interpolating between colours in three dimensional colour space with bezier curves. I highly recommend reading his article Mastering Multi-hued Color Scales with Chroma.js to understand more. He also includes a neat trick to make sure lightness increases linearly.
Divergent palettes
Now we know how to make sequential palettes, we can make divergent palettes by sticking two sequential ones back to back. You may need to put in a neutral shade in the middle. Gregor has even made a tool for that.
Some notes
As advised by graphiq, choose colours that make sense. This generally means faint colours for low numbers and stronger colours for high numbers, although this might depend on your data.
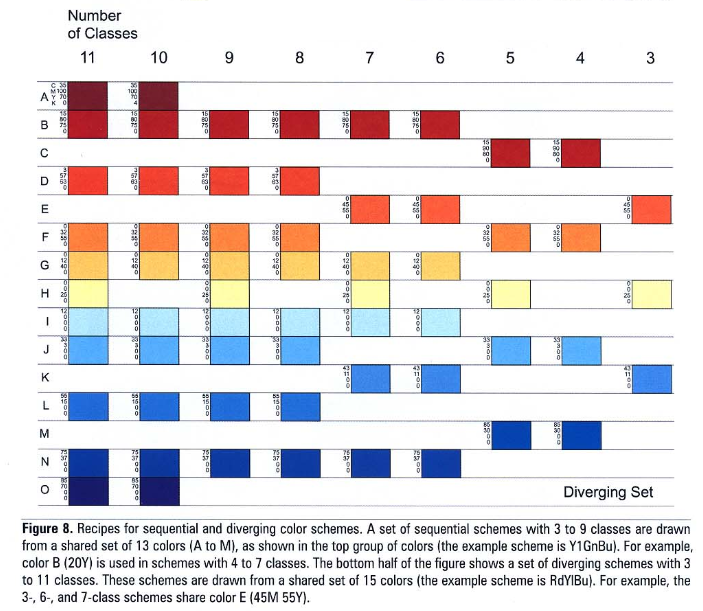
You are going to need to think through the starting points for your colours. The more colours you have in your scale, the more you’ll need to move your start and end further away from each other, to ensure your colours have enough distance between them. For example see how Colorbrewer does it (from this paper).
Categorical colours
Choosing distinct colours is hard. We know that variation in chroma and lightness make colours easier to distinguish.
For categorical colours, the difficulty comes when we need to keep chroma and lightness similar so colours don’t seem stronger than each other. But if we want the colours to work in greyscale you need variation in lightness. Getting some difference in lightness also helps viewers with colour so they aren’t relying on hue alone.
I Want Hue is a tool to help you choose to “generate and refine palettes of optimally distinct colors.” You set the possible colour space in HCL and it uses some maths to pick colours as far away from each other in colour space.
If we set the chroma range to 50-55 and lightness to 65-70 and ask it to generate 4 distinct colours we get.
On the surface, these look quite different. I Want Hue looks at the difference between colours and gives them a grading on how well they do. 5 out of the 6 of the colour pairs have smiling faces for colour distance so it’s easy to tell these colours apart. This drops to 1/6 if we consider colour blindness. But if we desaturate these colours we find these almost all the same.
| Colour | Desaturated colour |
|---|---|
| #afa746 | #a4a4a4 |
| #6e9df7 | #9e9e9e |
| #5faf66 | #9e9e9e |
| #f7767d | #9e9e9e |
So we need to introduce a bigger range of chroma and lightness. Taking inspiration from colorbrewer, their 5 colour qualitative palette has a chroma range from 21-50 and lightness from 45-98. Using these setting we get an example palette of
These work quite well with 6/10 smiley faces for normal vision and 2 of the colour blind modes.
With I Want Hue, you can set colours and lock them so if you need to use a certain colour that is possible too, for example if you had to include one brand colour and find 4 other colours there were equally distinct.
Conclusion
Now you’ve got your palette(s), why don’t you test it out in Susie Lu’s palette tool. So we didn’t quite come up with accessible colours but hopefully I’ve shown you what to think about to make the best colour palette possible to make it as accessible as possible.
Tools to help you choose colours
- HCL-picker. Pick start and end points for colours and make a scale between them. Also see it used in an example maps
- Gregor Aisch’s palette tool built off chroma.js
- Pick distinctive colours with I Want Hue
- David Johnstone’s Cubehelix gradient tool
- HSLuv colour picker tool
- Colorgorical
Colour advice articles
Datawrapper articles on colour, guide to colour and colour for choropleth maps